TCT FUSION results
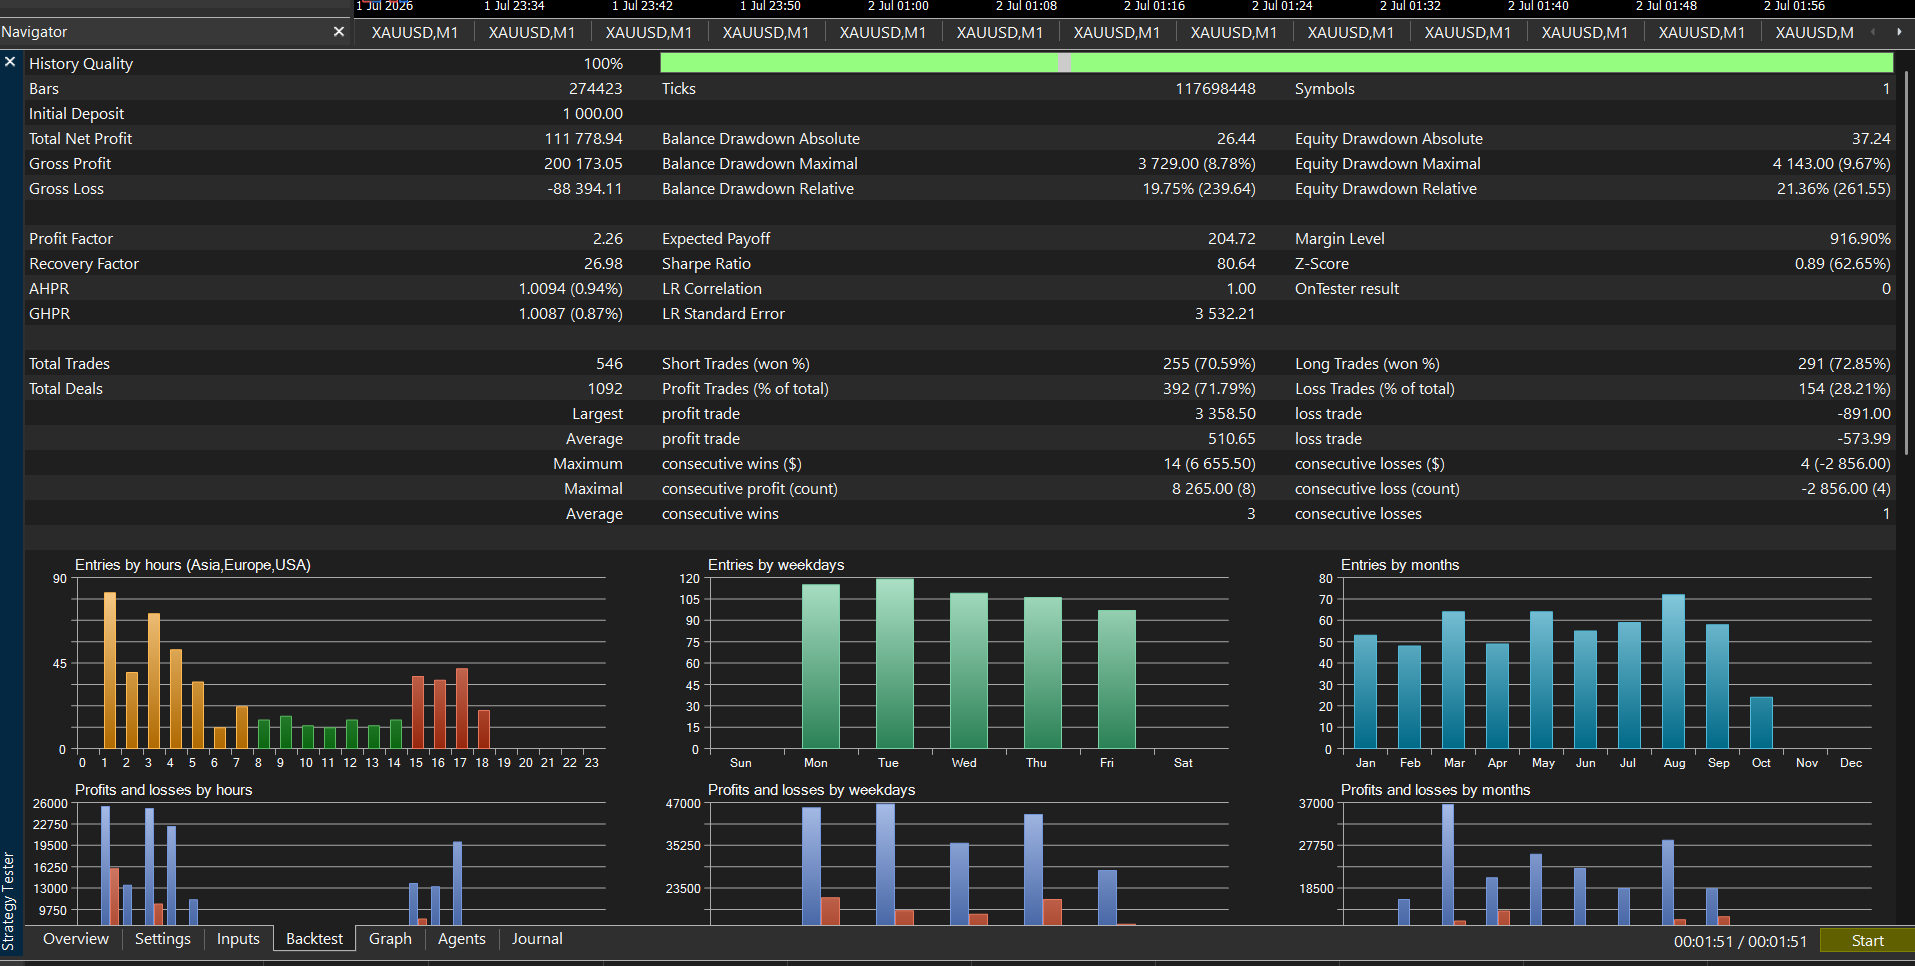
Let TCT FUSION monitor the market and manage trades automatically. Keep your MT5 setup running 24/7, with trading during available market sessions. Explore its promising historical backtest results below; future returns are not guaranteed.
1 Jan–11 Oct 2026 · $1,000 deposit · 0.01 lot per $100 equity · maximum 1.50 lots · USD
- Net profit
- +$111,778.94
- Total trades
- 546
- Winning trades
- 71.79%
- Profit factor
- 2.26
- Relative equity drawdown
- 21.36%
- Max dollar equity drawdown
- $4,143.00
Historical MT5 simulation, not independently audited live returns. Progressive tests began with $1,000, whereas fixed-lot tests began with $500. Both use the M1 test period.
TCT FUSION lot-size illustration
Change the lot size to see how profit and dollar drawdown scale in a simple linear model.
- Lot multiplier
- 1.00×
- Theoretical net profit / loss
- $961.61
- Theoretical ending balance
- $1,461.61
- Scaled dollar equity drawdown
- $27.62
Theoretical arithmetic only — not a backtest, forecast or guaranteed return. Multiplier = selected lot ÷ 0.01; net profit/loss and maximum dollar equity drawdown are multiplied by that factor. Ending balance = scenario balance + scaled net profit/loss. No compounding or new trades are simulated. Relative equity drawdown is not scaled.
This does not prove that a $500 account can sustain higher lots. Margin, leverage, spread, commissions, slippage, liquidity, stop-outs and the sequence of gains and losses can change or prevent these outcomes. Historical drawdown is not a future loss limit. The lot range is an input limit, not a recommendation.